|
Day 3-4: Analyze the DataFor these activities you need to have access to a software that you can make graphs (e.g., Excel). You can also use a graphing calculator (e.g., TI-82). After you finish these activities prepare a brief report with your results and send it to Davea students for comments. Ask them if they need any different kind of data analysis. Activity One: The data files of Carbon Monoxide, Hydrocarbons, Carbon Dioxide and Oxygen contain the measurements of these four gases taken in the emission tests of various cars. Plot each of the four gases on the Y axis (make a different graph for each gas) and each of the cars on the X axis to show how the four gases measurements have changed from car to car. Mark the maximum level of each gas permitted according to the specifications by the regulations. Compare the measured levels of the four gases for each car to the specifications.
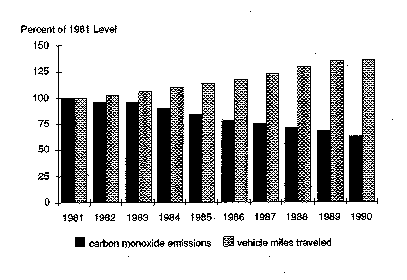
In the following figure you can see a sample graph of carbon monoxide emission and vehicle miles traveled.
Activity Two: In this activity you will compute the amount of carbon dioxide produced in pounds by the vehicles on which the emissions test has been performed. Plot the carbon dioxide measurements on the Y axis and cars on the X axis to show the carbon dioxide pollution trend in these cars. Use the following sample calculation (You are reminded that 1 mile=1.609 km, 1 gallon=3.785 l, and 1 pound=.453 kg) to find the amount of carbon dioxide produced in pounds by the vehicles.
Sample calculation--
To do these calculations, you can assume that:
The above graph you have made shows how much carbon dioxide each car contributes to the atmosphere each year. Can you estimate the amount of carbon dioxide produced in DuPage county? For the past year? For the past five years? How? Can you estimate the amount of carbon dioxide in your county for the next five years?
Activity Three:
|