|
Day 2-3: The Difference Statistic and ModelingThe Difference Statistic: We
need to ANALYZE our data. In order to do this you need to reduce your
findings down to a single number, which you can then determine the
significance of. How can you do this? Good question. We
need to ANALYZE our data. In order to do this you need to reduce your
findings down to a single number, which you can then determine the
significance of. How can you do this? Good question.
First of all, what is it that you are interested in about the
taste-test? Beginning with the assumption that people do not have any preferences for their soft drinks, you need to see how different your observations were from what you expected, which would be equal votes for all of the soft drinks. For example if 34
people voted, and there was no preference for any soft drink in the
group, to find the expected number of votes for each beverage you would
take the number of voters and divide by the number of beverages (in
this case 4). The result here is 34/4 which is 8.5. Using your results for the taste test, fill out the rest of
the table from the earlier page. Modeling:Now what? You have a d-statistic. What good does it do you? Remember the d-statistic is a measure of how far your results were from what you would expect them to be with no preference. But even with no preference, if you randomly selected from the four beverages you would rarely get exactly the same results, or even close. Let's try it.
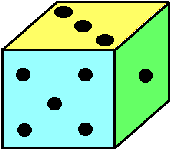
Roll your die and keep track of the results like this: Side Question: Why can you ignore the 5 and 6 and roll again? Click Here to explore this phenomenon. Roll as many times as were votes in your taste test. How do the results of your random taste test compare to your
actual one? Find where your real taste test d-statistic falls in the table of randomly found d-statistics. Count the number of values higher than your d-statistic and divide that by the total number of values. If this number is smaller than .1 then you can declare the highest vote getter the winner of the taste test. This is because that means there is less than a 10% chance that your value could have happened by chance, which means more than likely that there was some difference in the preference of the people polled. You may congratulate the victorious soda company by e-mail. |
 You will need: