|
|
|
|
What grabs your interest??? The goal of this project is to pick a theme or topic that interests you, and to explore it from a numerical perspective. What is an appropriate topic? Almost anything that interests you: SPORTS? It could be Michael Jordan, your favorite college sports team, Olympic sport, a professional team, or … MUSIC? What about a style of rock band? Or the great jazz trumpet players? Or Billboards Top 100? Or… NATURE? What about tigers or whales or even bugs? Or… MOVIES? The Star Wars series, or Indiana Jones adventures, or Independence Day? Or… POLITICS? The 2000 Presidential Elections , or… ALMOST ANY TOPIC that interests YOU!!!Don’t limit yourself! |
|
Got a topic in mind?? Good—because that’s the first step! Here are the general instructions for your theme-based poster. At each stage of the poster, your instructor will give you more detailed information. |
|
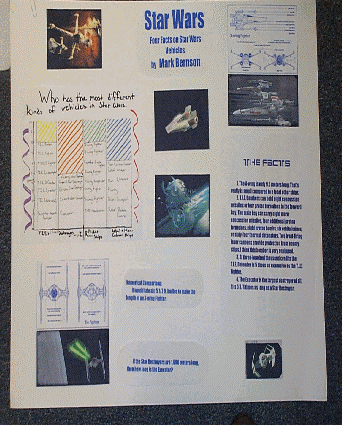
1. Choose a topic that interests YOU, and research it carefully. Try to find as much numerical information about the topic as you can. 2. Write six sentences that contain numerical facts related to your theme. Try to include as much variety as possible in the types of numerical information you use in your sentences. 3. Make a graph or chart. It can show relationships among your facts or it can show how one of your facts is related to facts of a similar theme. Be sure to include a title and appropriate labels for your graph. 4. Use a comparison by subtraction to make one of your sentence facts more meaningful. Use phrases like “larger than” and “less than” to describe the comparison. Include a visual representation of that comparison. 5. Use a ratio to illustrate or describe a comparison for a different one of your facts. Use words like “times as many” or “stacked on top of” to describe the comparison. Include a visual representation of that ratio. 6. Write three questions that could be answered after analyzing the information that you have provided. Ask at least one question that requires looking for a pattern or trend suggested by the graph. Include the answers, but hide them. 7. Compile all of the above into a poster presentation that is visually interesting and appealing. Neatness and creativity count! |
previous page next page Participant's table of contents Instructors' table of contents Number Sense home page M2T2 home page

