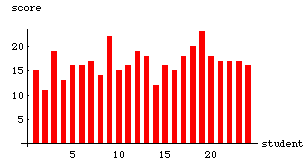


15, 11, 19, 13, 16, 16, 17, 14, 22, 15, 16, 19, 18, 12, 16, 15, 18, 20, 23, 18, 17, 17, 17, 16

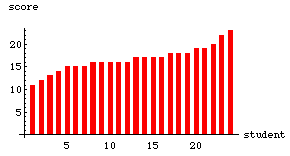
Remember, it is usually easier to interpret data when they are ordered.
11, 12, 13, 14, 15, 15, 15, 16, 16, 16, 16, 16, 17, 17, 17, 17, 18, 18, 18, 19, 19, 22, 20, 23

Now make a frequency bar graph of the scores.
send comments and questions to Jay Hill