3D Multi-Style Function Grapher
 What
is it?
What
is it?
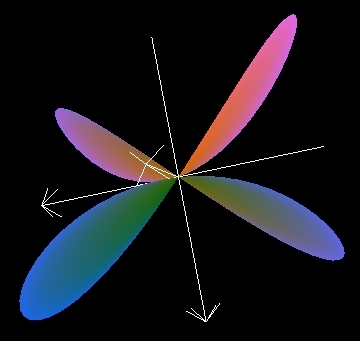
This is a 3D Grapher, utilizing the Parser
engine, which is capable of graphically representing 6 types of functions
in the 3D space.
What is it for?
For use mainly in a college-level calculus course to view functions
in a fully interactive environment. With the 6 types of functions it is possible
to represent most of the functions you will encounter in your courses.
How does it work?
The 3D Grapher takes 1 or 3 expressions
representing the function it is plotting and evaluates the expression(s) at
regular intervals (determined by the amount of detail specified in the HTML
code of the webpage) with the use of the Parser engine. The
results are then graphed and the user has the options to rotate the graph
and zoom in or out.
What functions can we use?
See the list of available functions (and brief explanations
of their workings) here.
What types of graphing modes does the 3D
Grapher support?
-
Cartesian - z(x,y)
-
Spherical - r(theta,phi)
-
Cylindrical - r(theta,z)
-
Parametric Cartesian
- {x,y,z}(s,t)
-
Parametric Spherical
- {r,theta,phi}(s,t)
-
Parametric Cylindrical
- {r,theta,z}(s,t)
What are the requirements?
-
- The latest final (non-beta) version is recommended
-
-
- If you have the most recent DirectX
files, you can download the DirectX version. Otherwise, download the OpenGL
version
- Apple users, please use this Java3D
API link
- Desktop resolution of at least 1024x768.
To fully see the applet you may need to put your browser into Full Screen
mode (F11 in IE, Opera and Mozilla).
How do I run it?
Choose from the following rendering settings. A faster setting will also use
less memory, but will be less accurate
What do the 'Fast', 'Normal' and 'High Quality' settings actually mean?
These settins represent how many polygons are used to make up the graph.
'Fast' setting uses a 20x20 grid, using 400 polygons. 'Normal' setting uses
a 50x50 grid, 2,500 polygons. 'High Quality' uses a 100x100 grid, 10,000 polygons.
Clearly, the more polygons that are used to display a function, the better and
more precise the results will be, but at the same time it takes longer to calculate
the required values and more memory to store the collection of polygons.
To more clearly understand the difference, notice that 'High Quality' uses 25
times more polygons than the 'Fast' setting. This means that for each polygon
in the plot of the 'Fast' graph, there are 25 polygons in the plot of the 'High
Quality' mode. This gives the 'High Quality' setting that much more detail as
opposed to the 'Fast' mode.
But even regardless of the number of polygons, understand that even 'High Quality'
may miss important graph details. For example, for a function in cartesian coordinates
that contains a value of infinity in the very middle of the graph, the resulting
plot will contain a hole in the center. It is impossible for the system to comprehend
infinity as a real value, so those polygons that contain infinity as one or
more of the verteces are removed from the graph. If you graph "1/0"
in cartesian mode, the graph will not change at all, since the graph you asked
the program to draw is an empty one.
If you want to judge for yourself exactly how fast 'Fast' setting is, use the
Java Console. (IE and Mozilla: The console is in the Taskbar, by the clock.
Opera: The console can be opened through the Opera menus,'Window'->'Special'->'Java
console')
The console lists the start and end types for calculations of the graphs and
gives appropriate output in case the graph you are trying to plot is empty.
Problems?
If you are having problems loading the Applet,
a possible solution is to update your Java Runtime Environment.
To update your JRE, go to SUN's
Java Webpage and follow the link to download Java software.
If you are having problems using the applet, please notify
Pavel
Safronov.
Please specify the applet you are using,
your web browser, operating system and the particular problem experienced. Please
be as detailed as possible.
The
Credits:
Applet designed and coded by Pavel
Safronov.
Contact at MSTE offices:
505 East Green Street, Suite 102
Champaign, IL 61820
Please e-mail me with comments, error reports
or complaints you have about the applet.