|
Hints: |
|
|||||||||
|
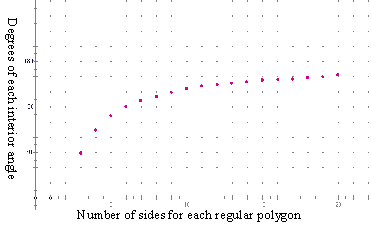
We want to explore different ways to get at the pattern. That is, look at it visually and with variables.
Spend time talking about discreet vs. continuous graphs. Why would it not make sense to connect the points on the graph if we are talking about polygons.
In mathematics a limit is a value that is approached increasingly by a function or a sequence. |
1. Have the participants label the axes. Make the horizontal axis the number of sides and the vertical axis the angle sums. Participants may have trouble with labeling graphs since there will be different scales. That is, the vertical axis should have hash marks labeled 180,360, etc. and the vertical will be labeled 3,4,6... Internet Resources: An excel chart with these values is available at https://mste.illinois.edu/m2t2/table2Polygons.xls . |
| previous page | next page | Instructors' table of contents | Participant's table of contents | Algebra home page | M2T2 home page |

