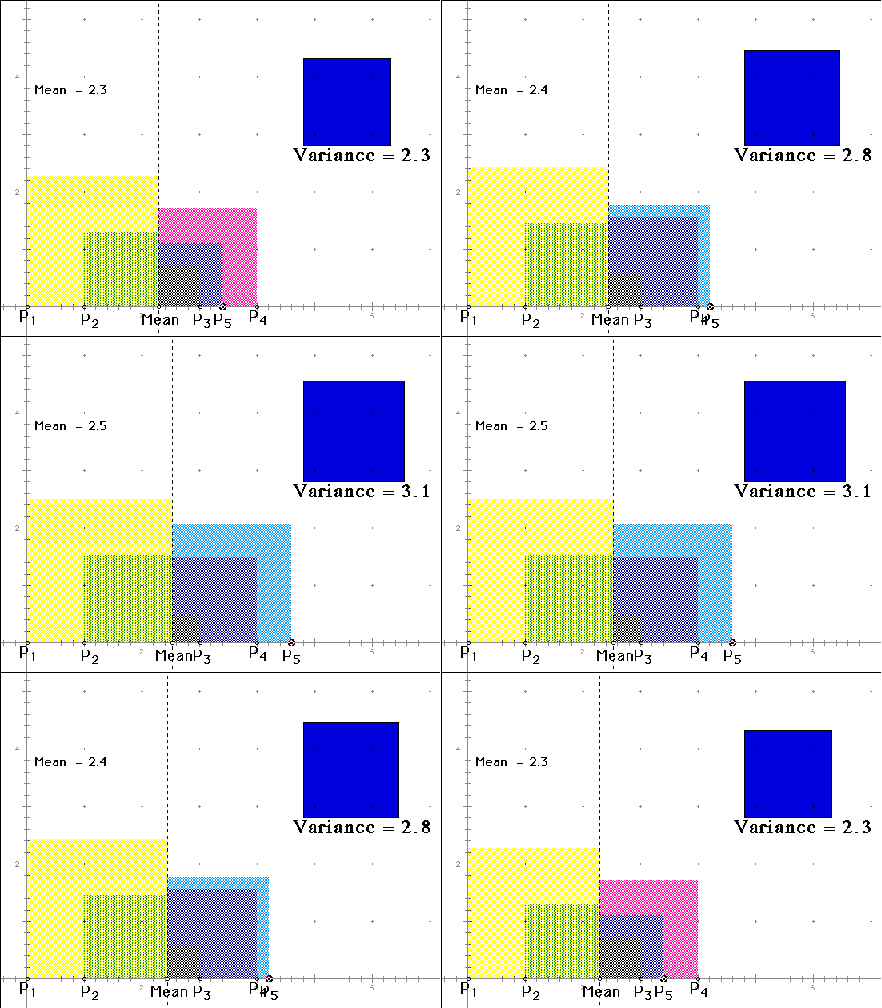
Here is a good representation of variance. There are five points on the x-axis (each represents a score). The mean is shown on the x-axis, as well. The distance from each point to the mean is squared (represented by the squares). Each square's area is equal to the square of the deviation score for each point. The variance is shown as the square in the top right hand corner.

Notice what happens to the variance as P5 (point #5) increases and decreases. What happens to the mean?
Now, please continue and learn a little about standard deviation.
send comments and questions to Jay Hill