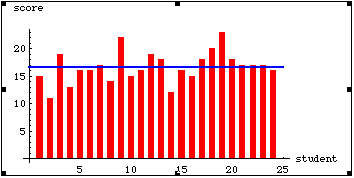


Let's look at the dice game again. Pool all of the scores in your class so we can compare them. Here is a sample set of scores (you may download this set of scores as a spreadsheet if you have access to Excel):
15, 11, 19, 13, 16, 16, 17, 14, 22, 15, 16, 19, 18, 12, 16, 15, 18, 20, 23, 18, 17, 17, 17, 16
Now, then put them in order (lowest to highest or highest to lowest, it doesn't matter).
11, 12, 13, 14, 15, 15, 15, 16, 16, 16, 16, 16, 17, 17, 17, 17, 18, 18, 18, 19, 19, 22, 20, 23
Find the average: Average = (sum of all scores) / (number of scores)
The average of our sample set of scores is 16.667. So, using this measure, anyone who scored above a 16.667 did well and anyone below 16.667 should try rolling again. "Luck be a lady tonight!"

Please continue on to learn about the median. If you have already studied the median, you may go on to the section on central tendency.
send comments and questions to Jay Hill