

Using the palm (and palm OS) in Mathematics
Education © James P. Dildine, 2001
Some Examples to Pursue
|
Age |
Blood Pressure |
Age |
Blood Pressure |
|
34 |
120 |
55 |
140 |
|
38 |
114 |
57 |
152 |
|
44 |
140 |
60 |
157 |
|
44 |
136 |
63 |
149 |
|
49 |
147 |
72 |
162 |
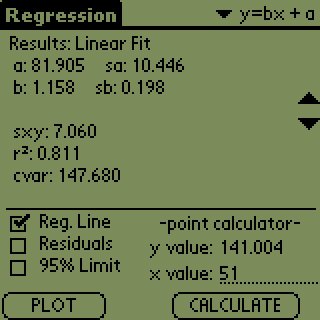
We will enter these data in out Palm App: ProStats
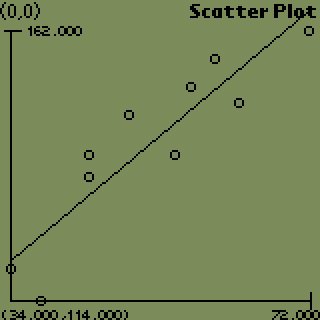
You can also use Lin Reg toPlot (x,y) data as (age, years) and determine linear regression model to describe data.
|
|
|
So the story about our data from these three stats programs analyses:
It seems that as a woman ages her systolic blood pressure rises as evident by the comparison line graphs on quicksheet and the linear "trend line" thru the belt of data from the Linear Regression Program. The average age of women surveyed was 51.6 with a standard deviation of 11.9 and the average Systolic BP was 141.7 with an SD of 15.3.
Easy Calc - Graph several expressions and compare them. The Graphs of three functions are shown in the table and palm below. What is the relationship between the three graphs over the interval 1 to 2 ?
|
Y = 2 * X |
|
|
Y = X ^ 2 |
|
|
Y = 2 ^ X |


